

Satellite derived temperature of the lower stratosphere (TLS) from University of Alabama shows a strong signal from the two stratospheric volcanic eruptions that occurred during the sample period : El Chichon and Mt Pinatubo.
The material ejected into the stratosphere blocks incoming solar, warming the stratosphere and cooling the troposphere and the surface. In each case the perturbation lasted less that five years.
After the particulate matter and aerosols have dropped out there is also a long-term depletion of stratospheric ozone ( 5 to 8% less after Pinatubo ) [1]. It is likely that the mechanisms that remove the volcanic ejecta also remove other natural and anthropogenic stratospheric pollution. The relative importance of these factors, which reduce the opacity of the stratosphere and allow more energy reach the lower atmosphere, has not been accurately determined.
What is notable is that, in both instances, TLS settled at a significantly lower level than before the eruption. Each event leading to a definitive drop of around 0.5 kelvin in globally averaged TLS.
This implies a similarly timed long-term change in energy budget at the tropopause ( the troposphere / statosphere boundary ) due to the changes in the composition of the stratosphere. The plateau in TLS since the last years of the 20th century is concurrent with the plateau in globally averaged surface temperatures and can clearly be differentiated from a possible effect of the long, slow rise in greenhouse gas ( GHG ) concentrations, which would be a continuous, nearly constant, rate of change.
A comparison of TLS to changes in top-of-atmosphere reflected shortwave radiation ( SW ) shows a change that closely matches the changes in the lower stratosphere. The magnitude of step change in short-wave is an extra 1.8 W/m2 of solar energy entering the Earth climate system, :
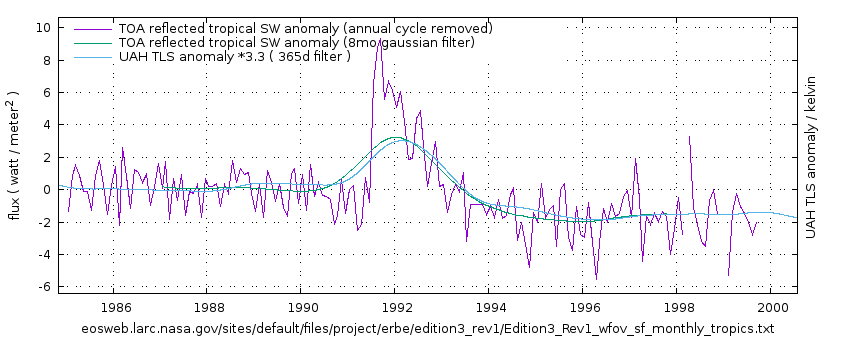
Derivation of this result: https://climategrog.wordpress.com/?attachment_id=955
Step changes recognised by NCAR
The step nature of changes in TLS is also noted by National Center for Atmospheric Research ( NCAR ):Stratospheric Temperature Trends [3]
Time series of stratospheric temperature anomalies from satellite data (Fig. 1) show overall cooling during 1979-2005. The time series are punctuated by transient warming events associated with the large volcanic eruptions of El Chichon (1982) and Mt. Pinatubo (1991), which persist for approximately two years. The overall cooling ranges from ~-0.5 K/decade in the lower stratosphere (~20 km), to over -1K/decade in the upper stratosphere (40-50 km). These values can be compared with warming in the lower atmosphere (troposphere) over the same period of order 0.1-0.2 K/decade…. the stratospheric changes are not monotonic, but more step-like in nature; note that stratospheric temperatures have been relatively constant over the recent decade 1995-2005.
Emphasis added.
This text is based on the paper “An update of observed stratospheric temperature trends” Randel et al 2009 [4]
Though the paper is still talking in terms of linear “trends” in degrees per decade, it may be noted that the major events where about 10 years apart and it would be more correct, in view of the step nature they have highlighted, to say 0.5K per eruption with no linear trend.
Thompson & Solomon [5] show the extent to which this variation correlates to stratospheric ozone.

An opposite but similarly timed effect is seen sea surface temperature, demonstrating the net warming of the lower climate system due to changes in energy budget cause by major volcanic events:

Description and further details here:
The scaling applied to align the southern hemisphere SST and TLS changes indicates a change of 0.1K / eruption or a linear “trend” of 0.1K/decade is attributable to the after effects of major stratospheric eruptions. This compares to Randel et al’s 0.1 to 0.2 K/decade “trend” in troposphere temperatures thus accounting for between 50% and 100% of warming in the last two decades of the 20th century.
This significant warming effect is currently being spuriously attributed to GHG and other human induced changes and goes a long way to explaining the increasing divergence between models and observational data.
Processing:
A 365 day, triple running mean low-pass filter was used to remove the annual signal from the daily, globally averaged, TLS data.
Data source: University of Alabama, Huntsville: temperature of the lower stratosphere from satellite microwave sounding unit (MSU) data.
http://vortex.nsstc.uah.edu/data/msu/t4/tlsday_5.6.txt
http://vortex.nsstc.uah.edu/data/msu/t4/tlsdayac8110_5.6.txt
Earth Radiation Budget Experiment ( ERBE ) top of atmosphere reflected shortwave radiation:
https://eosweb.larc.nasa.gov/sites/default/files/project/erbe/edition3_rev1/Edition3_Rev1_wfov_sf_monthly_tropics.txt
References:
[1] http://earthobservatory.nasa.gov/Features/Volcano/
[2] http://www.arl.noaa.gov/documents/JournalPDFs/ThompsonEtal.Nature2012.pdf
[3] “NCAR: Stratospheric Temperature Trends” http://www.acd.ucar.edu/Research/Highlight/stratosphere.shtml
[EDIT] This NCAR article has now been moved :
https://www.acom.ucar.edu/Research/Highlight/stratosphere.shtml
[4] “An update of observed stratospheric temperature trends”: Randel et al 2009 http://www.acd.ucar.edu/~randel/2008JD010421.pdf
[5] “Understanding Recent Stratospheric Climate Change”: http://journals.ametsoc.org/doi/abs/10.1175/2008JCLI2482.1
